

Graphing Quadratic Equations

Lesson Objective
In this lesson, we will learn about graphing quadratic equations.

About This Lesson
In this lesson, we will:
- Learn how to graph quadratic equations.
- See how we can graph the equation when the x-coordinates of the graph are given (1st math video).
- See how we can graph the equation when the x-coordinates are not given (2nd math video).
The study tips and math video below will explain more.
Study Tips

Tip #1
The general quadratic equation is given as:
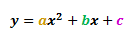
Where a, b and c are the coefficients of each term respectively. Depending on the value of a, a quadratic graph may have a 'U' shape or a '∩' shape.
When graphing quadratic equations, you will see shapes that are similar to the pictures on the right. Here are some basic guidelines to help you:
- Draw a x-y table to store the coordinates of all the points.
- It is better to have at least 7 points to get a good idea on how the graph looks like.
- Practice as many times as you can when drawing the graph, so that the curve will look smooth and steady.
-
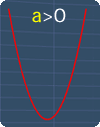
'U' Shape
-
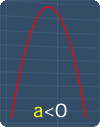
'∩' Shape
The math videos below will show you the steps to graph any quadratic equations.
Math Video
Basics on Graphing Quadratic Equations
Sponsored Links
Math Video Transcript
GRAPHING QUADRATIC EQUATIONS PART 1
00:00:03.230
This lesson will show the basics behind graphing quadratic equations.
00:00:09.050
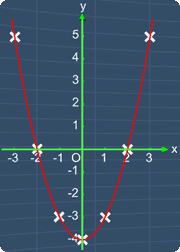
Consider this quadratic equation, y = x^2 -4.
00:00:15.120
Now, from this table, we can see that all the x-coordinates are given.
00:00:21.150
To graph the equation, we can use these x-coordinates to find all the y-coordinates.
00:00:28.060
After doing so, we will have the coordinates of seven points that can be used to graph the equation.
00:00:36.070
Let's start. When x is -3, we can substitute x in this equation with -3.
00:00:44.240
Now, let's simplify this equation. (-3)^2 square, is the same as -3, multiply by -3, which equals to 9.
00:00:56.230
Let's write this back here. 9 minus 4, gives 5. Hence, we get y equals to 5.
00:01:08.000
Now, let's fill in this box with 5.
00:01:12.210
With this, we have a point with the coordinates (-3, 5). This point is located right over here.
00:01:26.050
Let's calculate the next point. Substituting x, with --2. (-2)^2 is the same as -2, multiply by -2, which is equals to 4.
00:01:42.090
Let's write this number here.
00:01:45.120
Next, 4 subtract by 4, gives 0. Hence, we have y equals to 0.
00:01:54.080
Now, we can write the number 0, here.
00:01:59.100
By doing so, we get a point with the coordinates (-2, 0). This point is located right over here.
00:02:13.040
To find the next point, we repeat the same steps as before. Substitute x in this equation with -1.
00:02:23.100
Simplifying (-1)^2, gives 1. 1 minus 4 gives, -3. Hence, we have y equals to -3. Now, let's fill in this box with -3.
00:02:41.070
With this, we have a point with the coordinate (-1, -3), and this point is located right over here.
00:02:52.000
Now, by repeating the same steps for the rest of the x-coordinates, we will have all the y coordinates.
00:03:01.190
The point with the coordinates (0, -4) is located here. Next, the point with the coordinates (1, -3) is located here. Again, the point with the coordinates (2, 0) is located here. Finally, the point with the coordinates (3, 5) is located here.
00:03:32.090
Now, we have 7 points. By drawing a curve shown here, we can join these points together. This gives the quadratic equation, y = x^2 -4
00:03:49.200
That is all for this lesson. In the next lesson, we will learn about the vertex of a quadratic graph.
Graphing Quadratic Equations By Making Use of The Vertex Formula
Note that, before watching the video below, you should have some idea on the vertex of a quadratic equation...
Sponsored Links
Math Video Transcript
GRAPHING QUADRATIC EQUATIONS PART 2
00:00:03.210
In this lesson, we will learn another way for graphing quadratic equations.
00:00:09.120
Consider this quadratic equation, y = -x^2+2x+4.
00:00:18.000
First, we need a table to record the coordinates of the points that we are going to calculate.
00:00:24.190
Since the x-coordinates are not given in this table, we need a way to get them.
00:00:31.040
To do so, we can use the formula for the x-coordinate of the vertex of a quadratic equation, x = -b/2a.
00:00:40.240
To find the values of 'a' and ‘b', we can compare this equation with the general quadratic equation, y = ax^2 + bx +c.
00:00:54.090
For easier comparison, we can rewrite this equation as, y = -1x^2 +2x +4.
00:01:05.080
By comparing, we have, a=-1, b=2, and c=4.
00:01:15.120
Knowing this, we can substitute 'a' with -1, and substitute 'b' with 2.
00:01:23.180
Let's simplify this term. Now, this term is the same as, -2/2(-1). 2 multiply by -1, gives -2. -2 divides by -2, gives 1.
00:01:44.030
Hence, we have, x=1. Let's write this down here.
00:01:52.070
With this, we know that we have a point with the x-coordinate of 1, and this point is located at the middle of the graph.
00:02:01.010
Keeping this in mind, we can pick the rest of the x-coordinates, by taking three x-coordinates smaller than 1, which are, 0, -1, -2. And take three x-coordinates greater than 1, which are 2, 3, and 4.
00:02:21.040
Let's change back to the original equation. With all the x-coordinates, we can now use this equation to calculate the y-coordinates. Here’s how.
00:02:33.000
When the x-coordinate is -2, we can substitute x in this term with -2. Similarly, we can substitute x in this term with -2. Let's calculate for y. 2 multiply with -2, gives -4. -4 and +4, cancels off each other.
00:02:57.230
(-2)^2, is the same as, -2 multiply by -2. which is equals to 4. Let's write this down here.
00:03:10.050
So now, we have, y equals to -4. Let's write it here.
00:03:18.040
We can perform the same steps to find the rest of the y-coordinates.
00:03:23.240
After doing so, the table will be filled with numbers as shown.
00:03:29.120
Alright, let's put these points on the graph.
00:03:34.040
The point (-2, -4) is located here.
00:03:41.020
The point (-1, 1) is located here.
00:03:47.060
The point (0, 4) is located here.
00:03:53.070
Now, we repeat the same steps with the rest of the coordinates, and we will have all the points in placed, as seen on the graph.
00:04:02.000
Finally, we draw a curve to join these points together, as shown.
00:04:08.050
This is the graph of y=-x^2+2x+4.
00:04:16.020
That is all for this lesson, try out the practice question to test your understanding
--End of Transcript for Graphing Quadratic Equations 2--
Practice Questions & More

Multiple Choice Questions (MCQ)
Now, let's try some MCQ questions to understand this lesson better.
You can start by going through the series of questions on graphing quadratic equations or pick your choice of question below.
- Question 1 on the basics on graphing quadratic equations when the x-coordinates are given
- Question 2 on graphing quadratic equations when the x-coordinates are not given
Site-Search and Q&A Library
Please feel free to visit the Q&A Library. You can read the Q&As listed in any of the available categories such as Algebra, Graphs, Exponents and more. Also, you can submit math question, share or give comments there.
