Graphing Quadratic Equation Practice

Question Icon

Question 2

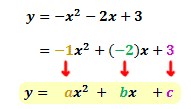
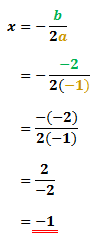
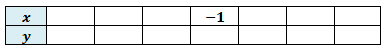
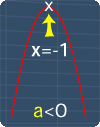
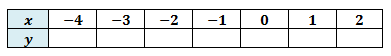
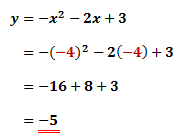
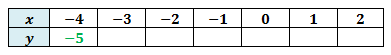
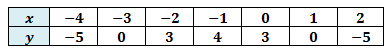
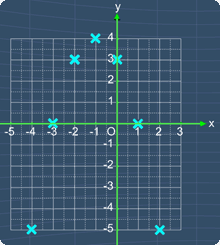
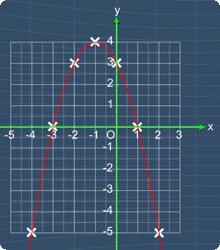
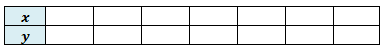
Fill the table below with the appropriate coordinates and graph the quadratic equation, y = -x2 -2x +3.

formula for the x-coordinate of the vertex, x= -b/2a

Step by Step Solution

  • Lesson Icon

    Step 1

    Before we start graphing, we need to fill the table with the appropriate coordinates. To do so, first, we have to get the x-coordinates by using the formula for the x-coordinate of the vertex:

    formula for the x-coordinate of the vertex, x= -b/2a
  • Lesson Icon

    Step 2

    To use the formula, we need to get the values of a and b. We can do so by comparing the given quadratic equation with the general quadratic equation as shown below:

    comparing the equations

    By comparing, we have a = -1, b = -2 and c = 3

  • Lesson Icon

    Step 3

    Now, we can substitute the equation with a = -1 and b = -2. By doing so, we can solve for x.

    calculating for the x-coordinate of the vertex

    Hence, we can fill the table with x = -1 as shown below:

    the x-coordinate of the vertex is -1
  • Lesson Icon

    Step 4

    With this, we know that the vertex has the x-coordinate of 1. Since the vertex lies on the center of the graph, we can choose the rest x-coordinates using x = -1 as a reference.

    location of the vertex

    Hence, we can choose three x-coordinates smaller than -1 (-2, -3, -4) and three x-coordinates greater than -1 (0, 1, 2). Therefore, the table becomes:

    table with all the x-coordinates
  • Lesson Icon

    Step 5

    We can start calculating the y-coordinates. For x=-4, we can calculate for the y-coordinate by substituting x with -4 into the equation:

    calculating the y-coordinate when x = -4

    Hence, we can fill the table as shown:

    when x = -4, y is -5
  • Lesson Icon

    Step 6

    By repeating the same step for the rest of the x-coordinates, we get the following:

    table with all the coordinates
  • Lesson Icon

    Step 7

    Hence, we can plot the points as shown:

    all the 7 points plotted on the graph
  • Lesson Icon

    Step 8

    By drawing a curve to join these points together, we get the graph of y = -x2 -2x +3.

    graph of y= -x^2 -2x +3