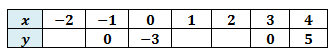
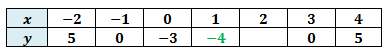
Graph the quadratic equation, y = x2 -2x -3. The table for the graph is given below:
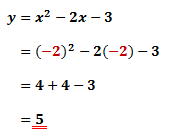
We can start by filling the table. For x=-2, we can calculate for the y-coordinate by substituting x with -2 into the equation:
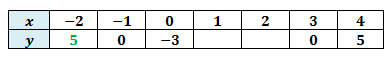
Hence, we can fill the table as shown:
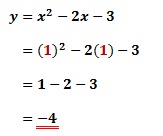
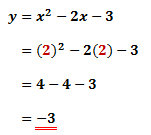
Similarly for x=1, we can calculate for the y-coordinate by substituting x with 1 into the equation:
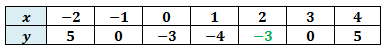
Again, for x=2, we can calculate for the y-coordinate by substituting x with 2 into the equation:
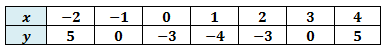
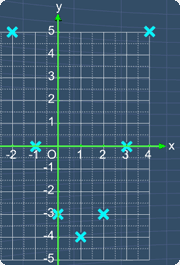
Now, we have a table filled with the following coordinates:
Hence, we can plot the points as shown:
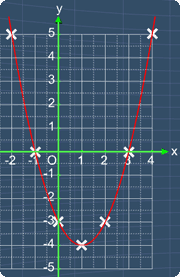
By drawing a curve to join these points together, we get the graph of, y = x2 -2x -3.
Join our FB group to download ZapZapMath Free today!
Join our Facebook Group