

Graphs: Graphing Linear Equations

Lesson Objective
This lesson shows you the steps on plotting (i.e. graphing) the graph of linear equations.

Why Learn This?
If you are given a simple equation and have been asked to visualize it, you will very likely able to do it mentally.
Now, if the equation gets more complex, you will soon find it difficult to visualize it mentally. This is where the coordinate plane is here to help.
With several simple steps, you will be able to draw out any equation. As a start, we will use the equation for straight lines.
Note that, straight line equation is also known as linear equation.
Study Tips
As you watch the math video below, try to remember the following:

Tip #1
You need to draw a x-y table to help you to record the coordinates of your points in orderly manner.
Tip #2
Take note on how the coordinates of each point are calculated.
Tip #3
In this lesson, only few points are used to plot the equation. For more complicated equations, you may need to get more points to have a complete picture of the equation.
Now, watch the following math video to know more.
Math Video
Click Play to Watch
Sponsored Links
Math Video Transcript
00:00:04.010
Welcome to a new lesson. After mastering on how to read and write coordinates, we can now use it to visualize the graph a linear equation.
00:00:18.160
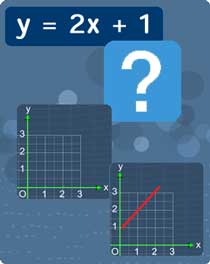
Let's say you are given the equation y = 2x + 1. This equation, by itself, may not makes much sense.
00:00:28.150
But if we were to use the Coordinate plane to plot a graph of this equation, you get to actually see how this equation looks like.
00:00:37.080
To do so, first, you have to draw out a table like this. This table is useful to store the coordinates of the point that you are going to calculate soon.
00:00:50.020
Now, let the variable x to take up the first row of this table.
00:01:03.110
Similarly, let the variable y take up the second row. With this, you can see that, these empty column here will used to store coordinates of one point.
00:01:26.190
Now let's start filling this table. Let me put the value, 1 in the box right here. By doing so, you will have a point on the plane with it's x-coordinate = 1.
00:01:45.030
But you have a problem. Though you have the x-coordinate as 1, you still do not know what is the y coordinate.
00:01:54.110
This is where you will have to use this equation, to find out the y coordinate of this point when x = 1.
00:02:04.100
Now, substitute x=1 right here, solve for y by first multiplying 2 with 1. You will get 2. 2 plus 1 gives you 3. Let's put this new value y = 3 into the table.
00:02:26.230
It now means that, when this point's x coordinate = 1, the value of y coordinate for this equation is 3.
00:02:37.020
With this newly calculated point, let us now adjust this point to the correct coordinates (1,3).
00:02:48.240
Alright, you now have your first point from y = 2x + 1.
00:02:56.230
To continue further, we will do the same thing for x = 2, x = 3 and x = 4.
00:03:11.190
For x =2 , we will now solve this equation. Substitute x=2. multiply 2 with 2 gives 4 .Add 4 with 1. You will get y = 5. Let's put this value into the table. Now, you have a new coordinates (2,5).
00:03:44.160
This point is located right over here.
00:03:57.180
For x =3 , we will now solve this equation. Substitute x =3..Multiply 2 with 3 gives 6. Add 6 with 1. You'll get y = 7. Let's put this value into the table. Now, you have a new coordinates (3,7).
00:04:29.160
This point is located right over here.
00:04:45.060
For x =4 , we will now solve this equation. Substitute x =4. Multiply 2 with 4 gives 8. Add 8 with 1. You'll get y = 9. Let's put this value into the table. Now, you have a new coordinates (4,9).
00:05:14.140
This point is located right over here.
00:05:26.230
You see that these points forms a pattern here.
00:05:33.000
Now, when we connect these points together, we will get a straight line. This line is the graph of y = 2x + 1.
00:05:42.150
So, what you have learn showed you how draw the graph of a linear equation.
00:05:48.030
Alright, that is all for this lesson. You can move on to the practice questions to test your understanding.
Practice Questions & More

Multiple Choice Questions (MCQ)
Now, let's try some MCQ questions to understand this lesson better.
You can start by going through the series of questions on graphing linear equations or pick your choice of question below.
- Question 1 on using a linear equation to calculate y-coordinates
- Question 2 on the basics of graphing linear equations
Site-Search and Q&A Library
Please feel free to visit the Q&A Library. You can read the Q&As listed in any of the available categories such as Algebra, Graphs, Exponents and more. Also, you can submit math question, share or give comments there.
